As ethereum continues its price fluctuations, technical indicators on the 1-hour, 4-hour, and daily charts suggest a bearish outlook with mixed trading signals. Despite some bullish undercurrents, the predominant sentiment remains cautious.
Ethereum
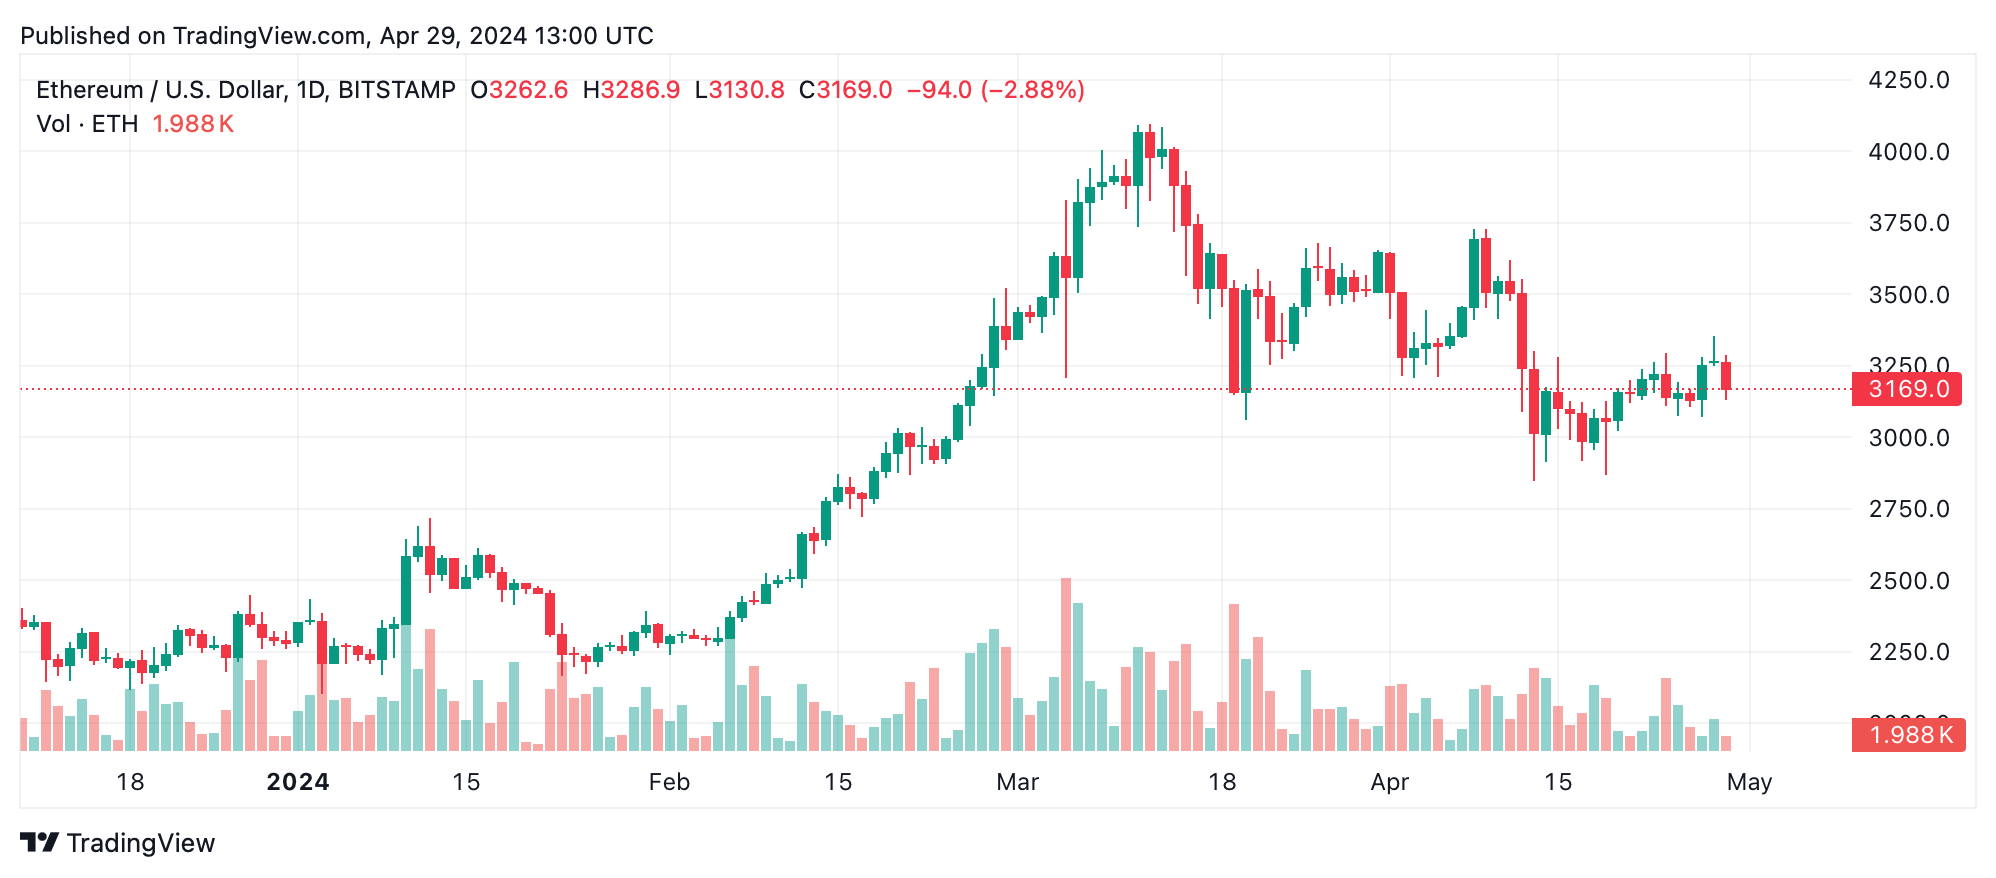
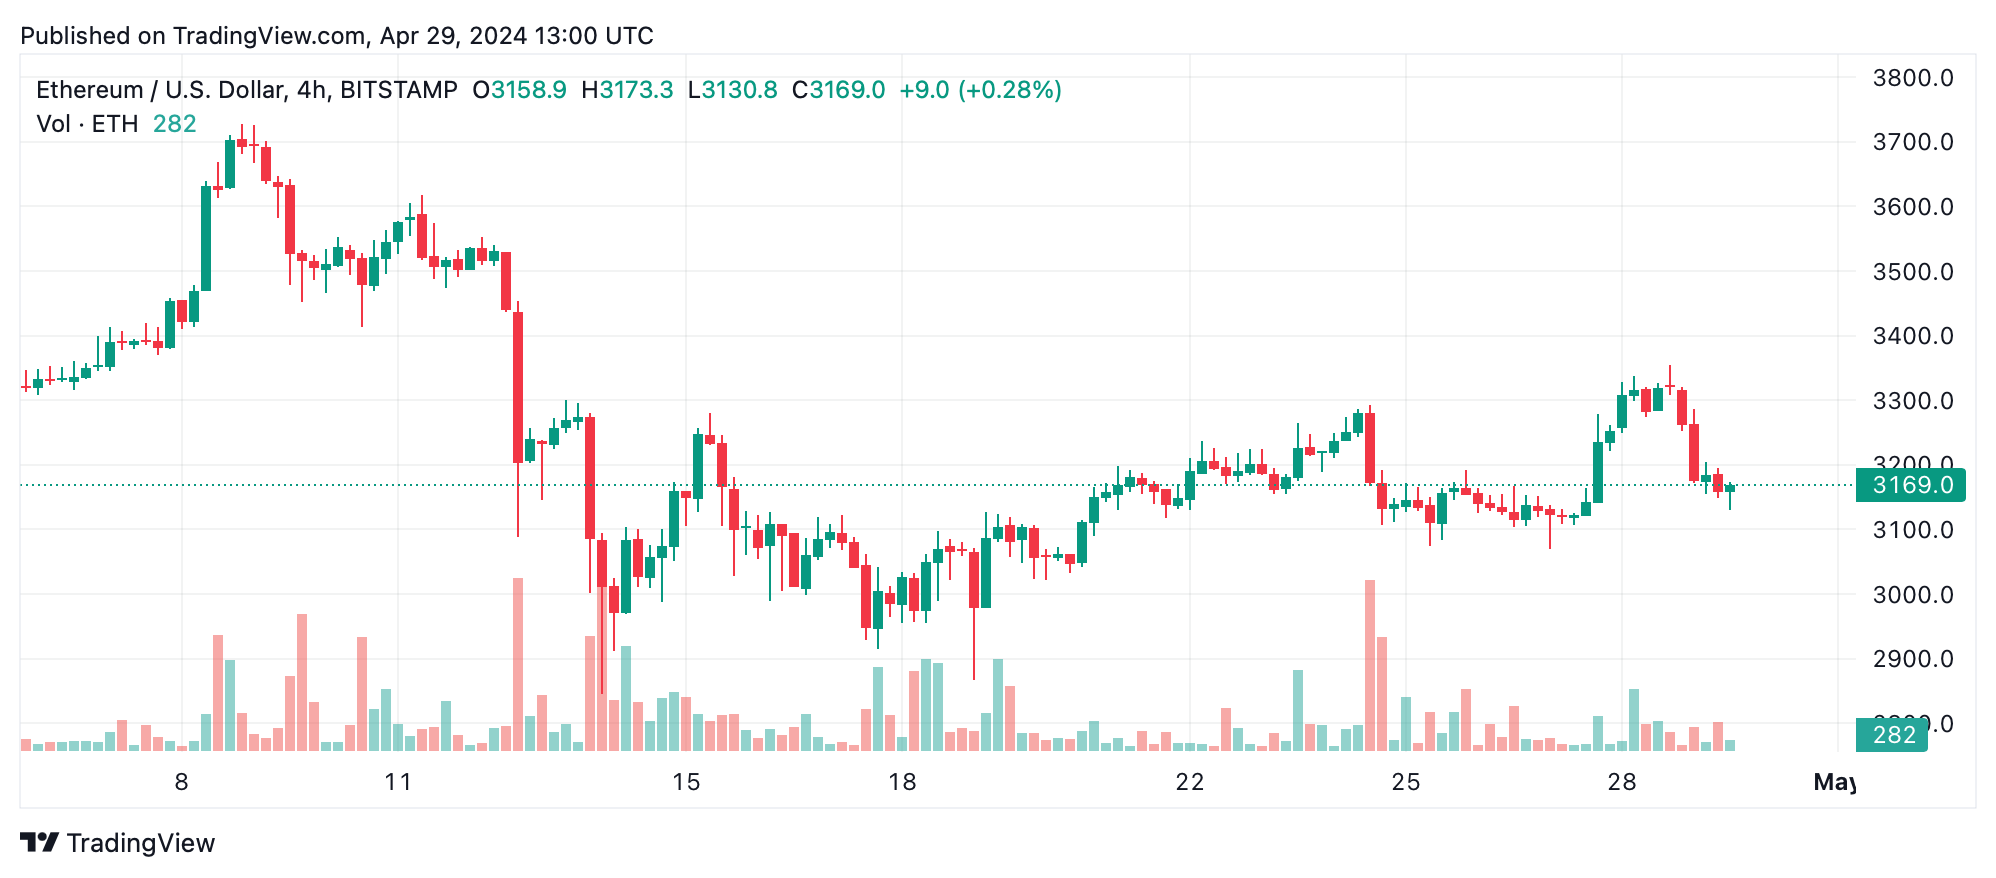
Ethereum’s (ETH) price action has shown a downward trend on the 1-hour chart, marked by a series of lower highs and lower lows, signaling continued bearish momentum. This downtrend is mirrored in the 4-hour chart where a recent sharp decline was followed by a modest recovery, only to descend again, indicating strong selling pressure. The daily chart underscores this bearish narrative with a significant downward trend from recent highs near $3,730, further solidified by the recent consolidation, suggesting a weakening momentum in the sell-off.
Oscillators present a neutral to mixed stance with the relative strength index (RSI) at 46.2, hinting at neither overbought nor oversold conditions, and the moving average convergence divergence (MACD) showing a divergence towards buying. However, the majority of the ETH/USD moving averages (MAs) highlight negative sentiment, particularly across shorter spans like the 10, 20, 30, and 50 periods, indicating prevailing downward price movements. Only the longer-term 100 and 200 periods show bullish signals, potentially forecasting a future stabilization or upward correction.
Current ETH trading volumes are modest at $14.15 billion over the last 24 hours, with ethereum’s market capitalization holding steady at $386 billion. This volume, coupled with significant price variability within the day’s range from $3,154 to $3,345, points to active market participation but also underscores the uncertainty and high volatility in current market conditions.
Given the mixed signals, traders should consider cautious entry and exit points. For bearish positions, potential entry could be at a retest of recent resistance levels or a breakdown below support at $3,149 on the 1-hour chart. Exit points could be set near resistance or upon clear reversal patterns. Conversely, a bullish reversal could be signaled by a close above the high of the last large bearish downturn, which might serve as an entry for long positions if other indicators align.
Bull Verdict:
Should ethereum’s price stabilize and hold above the key 200-day moving average, coupled with a positive crossover in MACD levels, there could be a foundation for a bullish reversal. This potential uptrend is further supported by any sustained break above recent resistance levels, suggesting that the current bearish phase might be losing steam. Traders should watch for increased buying volume and reversal patterns on the daily chart as indicators of a shift toward a bullish sentiment.
Bear Verdict:
Despite occasional bullish signals, the overarching bearish trend highlighted by consistent lower highs and lower lows across the 1-hour and daily charts suggests that ethereum may continue its descent. The predominance of ‘sell’ signals across most moving averages and the lack of strong bullish momentum in oscillators reinforce this perspective. Traders should remain wary, as any failure to break above key resistance levels could lead to a continuation of the downward trend, potentially testing new lows.