As ethereum continues to navigate a period of significant price fluctuations, traders are keenly observing a variety of technical signals from the 1-hour, 4-hour, and daily charts. The combination of oscillators and moving averages provides a nuanced view of potential entry and exit points.
Ethereum
The 1-hour chart for ethereum (ETH) reveals notable fluctuations, with prices swinging between $3,116 and $3,236. This variability suggests promising opportunities for short-term traders, especially if prices find stability at these points. Investors might look to buy near the $3,116 level, identified as a support, if upward trends become apparent, planning exits prior to reaching the $3,236 resistance—a level where prices previously peaked.
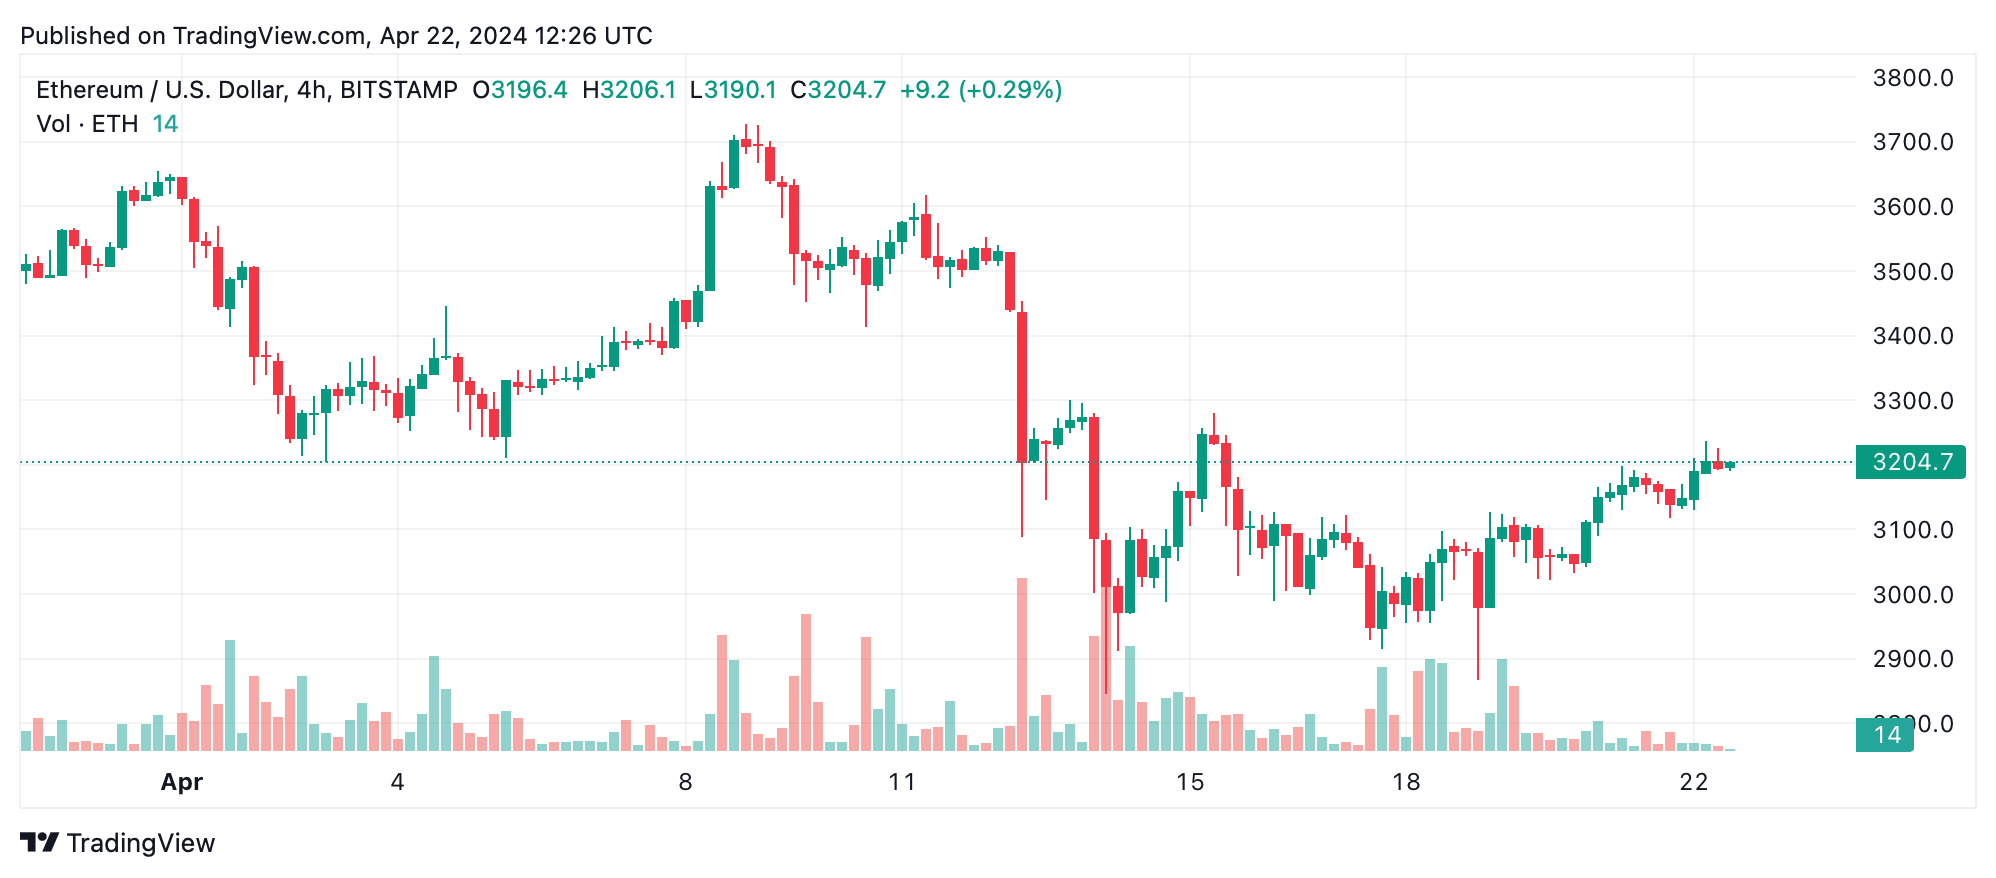
Shifting to the 4-hour chart, ETH presents a broader ascending pattern following a rebound from the $2,864 support. This perspective indicates a consolidation of recent gains, with the price aiming for new highs. It’s advisable for traders to watch for a solid recovery from this support level and to set stop-loss orders slightly below to mitigate risks of potential declines.
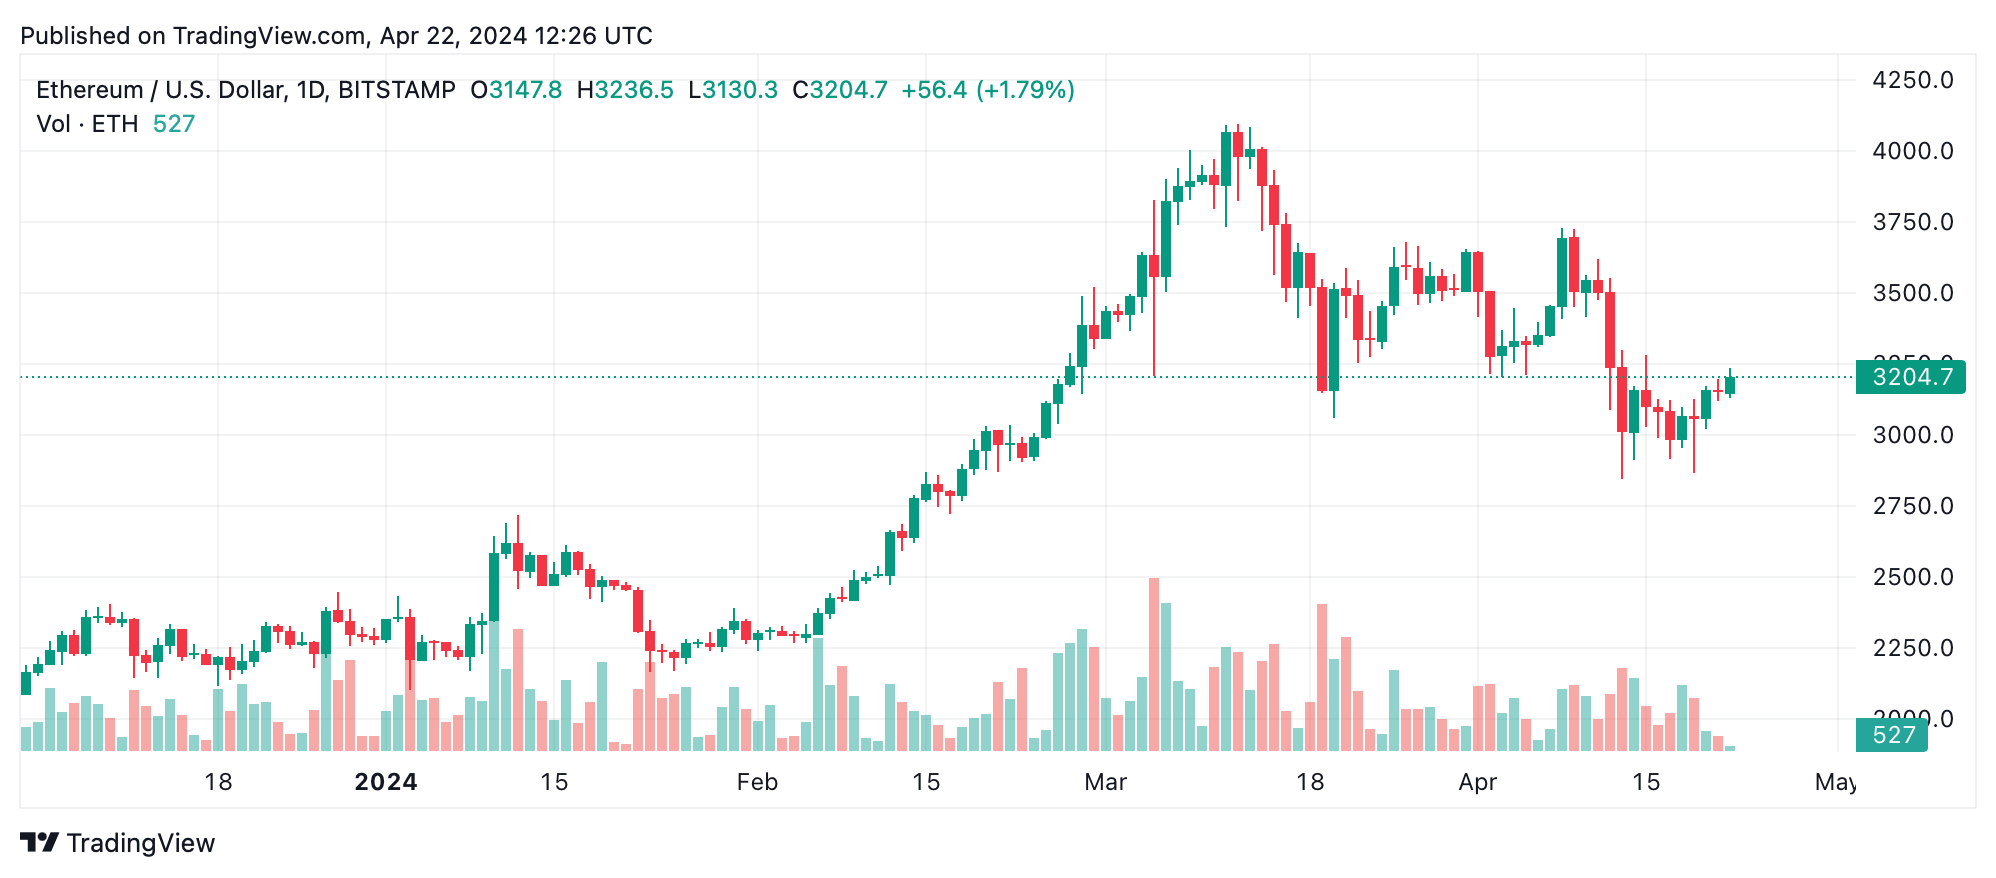
On the daily chart, ethereum’s trading activity is captured within a larger price bracket from $2,801 to $3,730, underscoring crucial support and resistance levels. An effective trading strategy may involve entering close to the $2,801 mark, particularly if a clear reversal trend emerges, suggesting a bullish turn. Conversely, planning an exit near the $3,730 resistance could be prudent, as this threshold has historically been a challenging point for ethereum’s price.
The trading landscape is further complicated by mixed signals from oscillators and moving averages. The moving average convergence divergence (MACD) indicates a bearish outlook, while the day’s momentum appears more bullish. Traders should adopt a balanced strategy, taking into account both bearish and bullish signals from various timeframes to craft a well-rounded trading approach.
Bull Verdict:
Ethereum’s current positioning in the market, particularly evident in the sustained higher lows on the 4-hour chart and positive momentum signals, suggests a bullish outlook. Traders should look for opportunities to enter long positions near key support levels, leveraging the overall upward trend. The resilience shown at these supports, combined with potential bullish reversals on the daily chart, underpins a favorable scenario for Ethereum’s price advancement in the near term.
Bear Verdict:
Despite the optimistic signals on shorter timeframes, the bearish indicators such as the MACD and a series of sell signals from the longer-term moving averages present a cautious narrative. The resistance level at $3,730 poses a significant barrier that has previously stifled upward movements. Traders should consider the potential for a downturn from these highs, which could lead to profitable short positions if ethereum fails to breach this critical resistance, suggesting a retreat in prices.