Bitcoin’s price has been going through some major moves throughout the past couple of weeks. The bulls are fighting to reestablish their dominance, staging a convincing recovery above $60K. But will it last?
Technical Analysis
By TradingRage
The Daily Chart
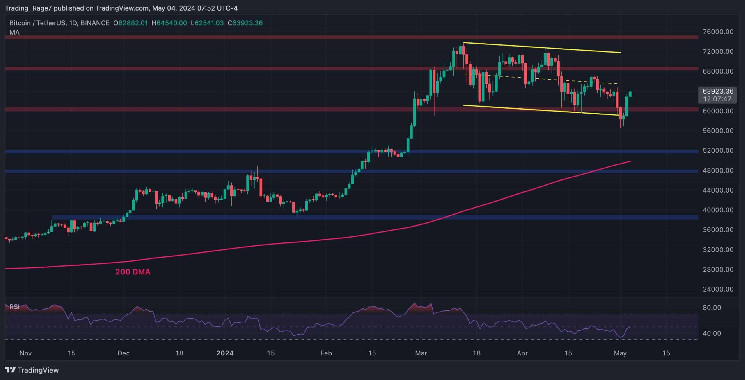
The price has been oscillating inside a descending channel on the daily chart for the past couple of months. The channel was briefly broken to the downside a few days ago.
However, BTC quickly rebounded and climbed back inside the channel, making a fake bearish breakout. With the $60K level also turning into support, the price will likely target the $68K resistance level in the short term.
The 4-Hour Chart
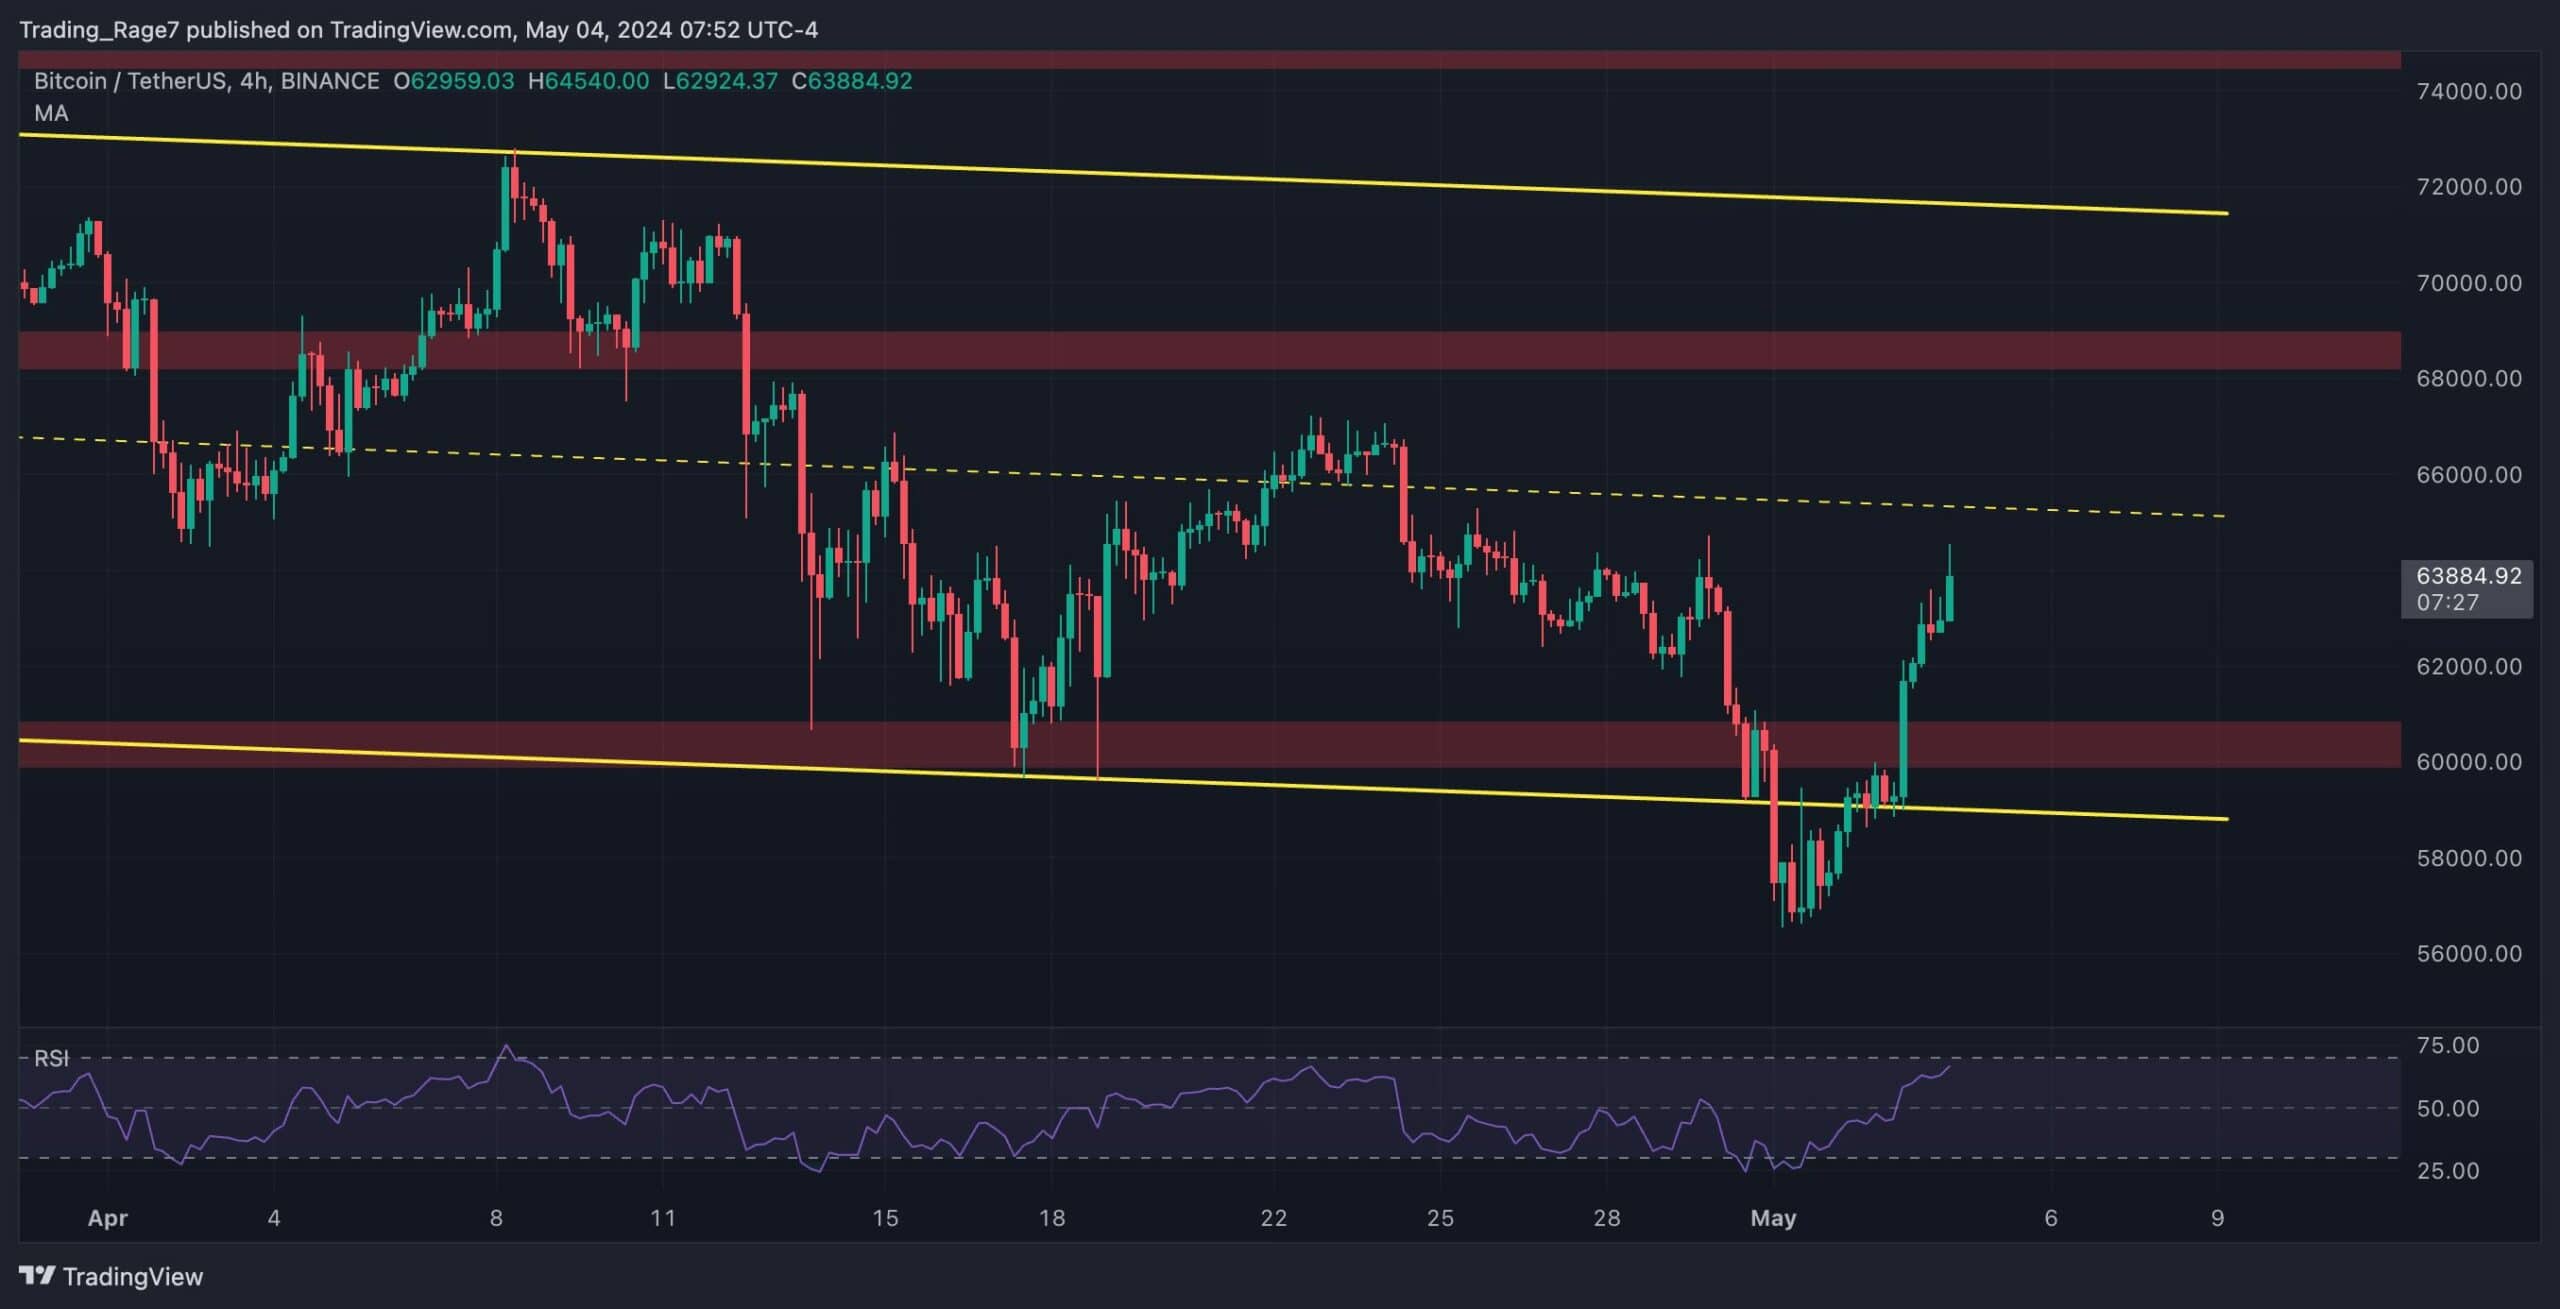
Looking at the 4-hour chart, it is evident that the price has quickly recovered from below the channel and the $60K level. The midline of the descending channel is now the next target.
Meanwhile, with the RSI approaching the overbought zone, the price might experience a pullback soon. The continuation of the bullish trend is dependent on whether the price can finally break the channel to the upside.
On-Chain Analysis
By TradingRage
Bitcoin Miners Position Index
While Bitcoin’s price has been trading below the $75K level, many market participants have been offloading their coins as they assume that the bull market might be over or a much deeper pullback is probable. However, miners are not in this group.
This chart demonstrates the Miners Position Index (MPI) metric. It measures miners’ selling pressure. Values above 2 can be considered dangerous, as they show massive destruction by the miners.
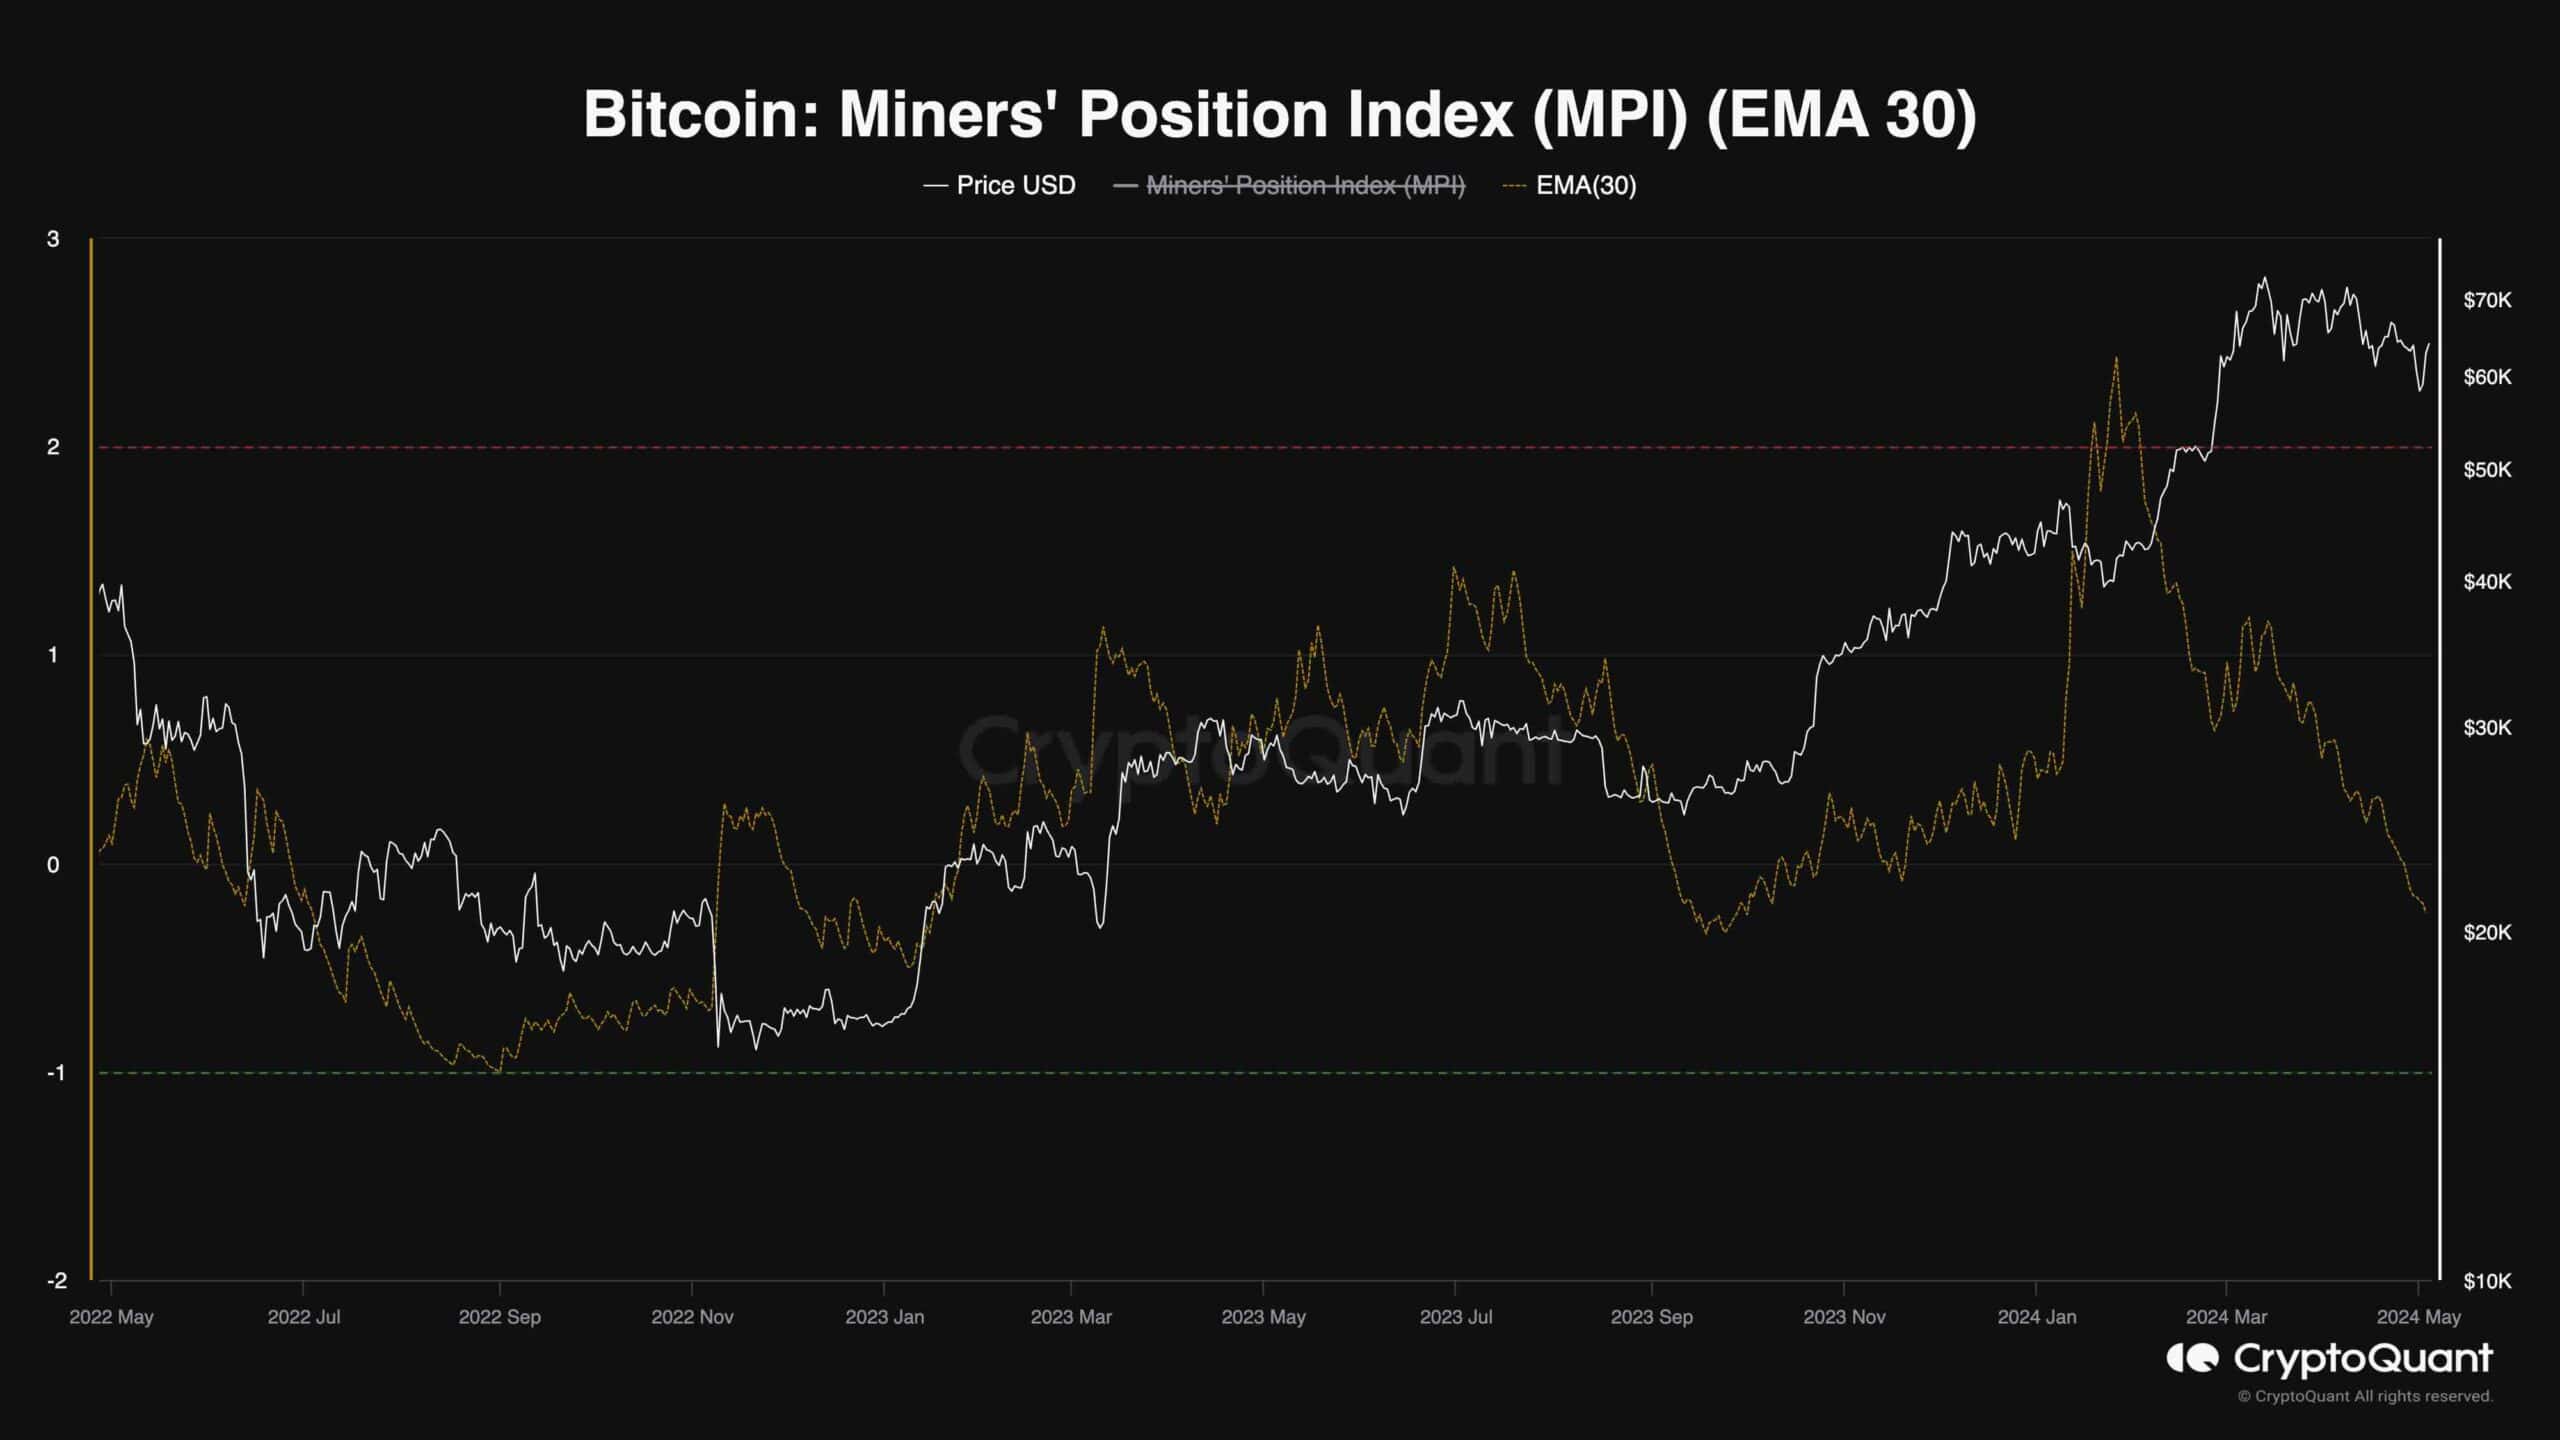
As the chart depicts, the MPI has been dropping rapidly over the last few months. This is a good sign, as the Miners’ selling pressure is declining. Thus, with sufficient demand, Bitcoin’s price can once again begin a rally toward $80K and even higher prices.