April has become a challenging month for Bitcoin, with the cryptocurrency sliding below its immediate support levels and nearing its weekly lows. The combination of macroeconomic and geopolitical issues has intensified the struggles for Bitcoin bulls throughout the month. Nonetheless, amidst these bearish conditions, a key indicator to monitor is the Short-Term Holder (STH) Realized Price. This metric points to a potential prime buying opportunity in anticipation of a bullish reversal.
Bitcoin’s STH-Realized Price Flashes Buying Opportunity
Over the last 24 hours, the crypto market is witnessing heavy long liquidation as the total liquidation amount nears $120 million. Both Bitcoin and Ethereum prices have been declining strongly, suggesting robust selling pressure by buyers.
Bitcoin and cryptocurrency traders have endured a week of price drops, but a pivotal reset appears to be on the horizon. According to CryptoQuant, the STH-Realized price for Bitcoin is flashing a bullish metric and it might be profitable to buy Bitcoin now near the dip.
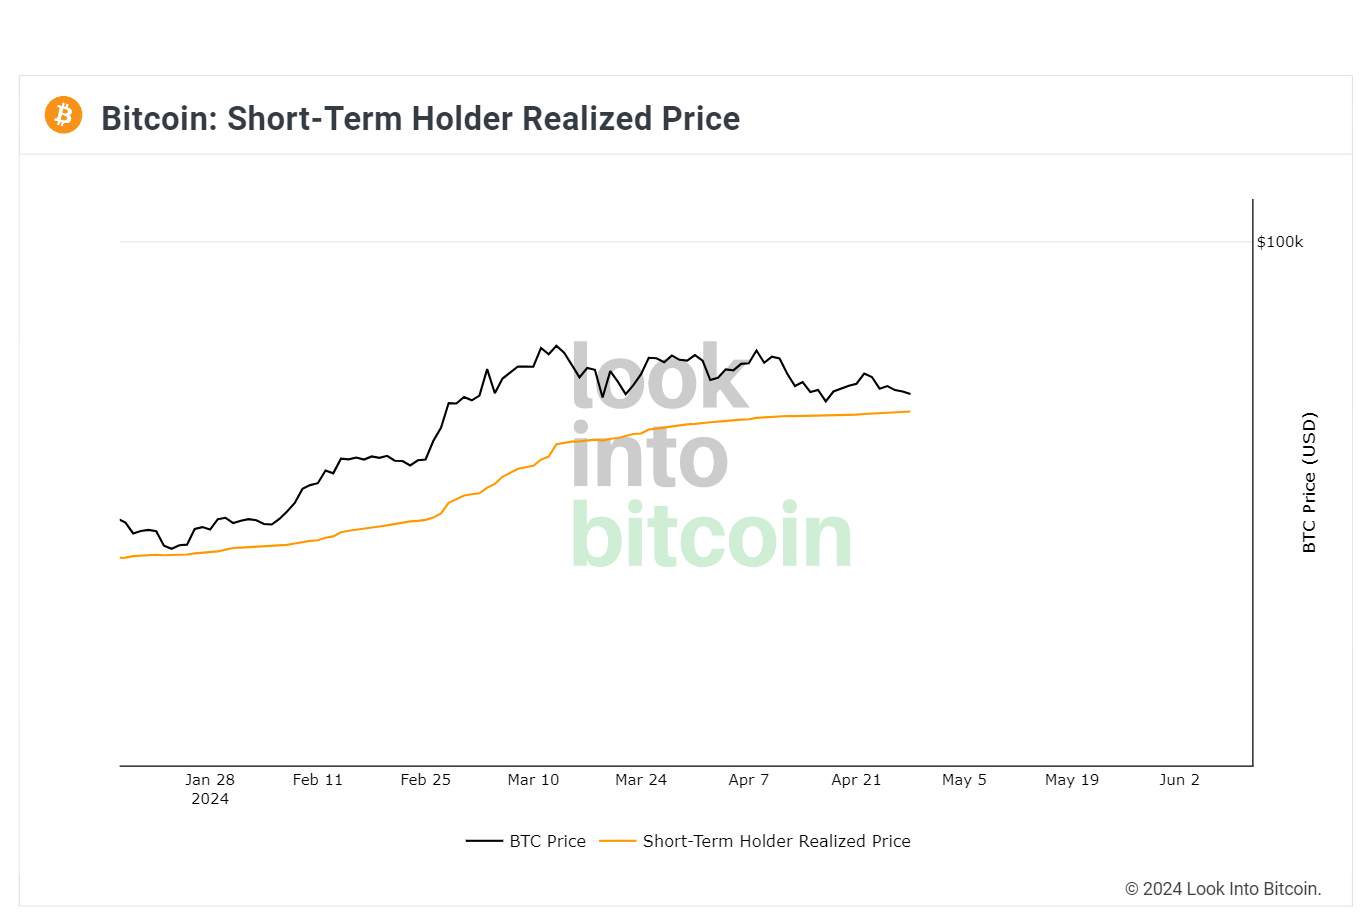
The STH-Realized Price represents the average price at which Bitcoin was last moved by investors who held it for a short duration, typically less than six months. This metric is crucial as it reflects the cost basis of the most recent market entrants. In essence, it provides a snapshot of the price expectations and sentiment of newer market participants.
The metric is currently around $59,788, suggesting this as a crucial short-term support for
price. Currently, Bitcoin’s market price holding above the STH-Realized Price suggests that confidence among recent investors is high and that the momentum of the market could continue upward. For long-term investors and newcomers, investing at the current price might turn profitable.
If Bitcoin is still in a bullish season, the STH-Realized Price is a very good buying opportunity
— CryptoQuant.com (@cryptoquant_com) April 29, 2024
“The BTC STH-Realized Price is the average buy price of short-term market participants(~6M) and is the benchmark for identifying a #Bitcoin bull market.” – By @t0_god
Link 👇… pic.twitter.com/TFodWiPdn4
When the market price of Bitcoin remains above this average, it indicates that short-term holders are not underwater on their investments and are less likely to sell at a loss, thereby reducing selling pressure on Bitcoin.
The ongoing bullish sentiment in Bitcoin’s market is supported by various factors including institutional adoption (Hong Kong spot ETF), an increase in retail interest, and macroeconomic factors like inflation fears which position Bitcoin as a ‘digital gold’.
According to data from monitoring resource CoinGlass, this downturn marks Bitcoin’s poorest performance in a month since November 2022, which coincided with the peak of the previous bear market. Despite the lackluster price action of BTC, there’s a glimmer of hope as smaller retail investors are showing renewed interest. It was observed that the 30-day rolling wallet balances turned positive on April 8 for the first time since mid-January.
The resurgence of interest among retail Bitcoin holders, often labeled as ‘degenerates’ prone to selling at the first hint of a market correction, was an encouraging sign.
It was pointed out that “shrimp” holders, those with less than 1 BTC, were currently accumulating approximately 12.2k BTC per month, highlighting a bullish sentiment among smaller investors.
What’s Next For BTC Price?
Bitcoin has been oscillating within a range of $59,000 to $65,000 for a stretch of days, reflecting a standoff between bullish and bearish sentiments regarding the next market direction. Currently, bears are aiming to send the price below $60K to intensify their bearish dominance. As of writing, BTC price trades at $62,166, declining over 1.6% in the last 24 hours.
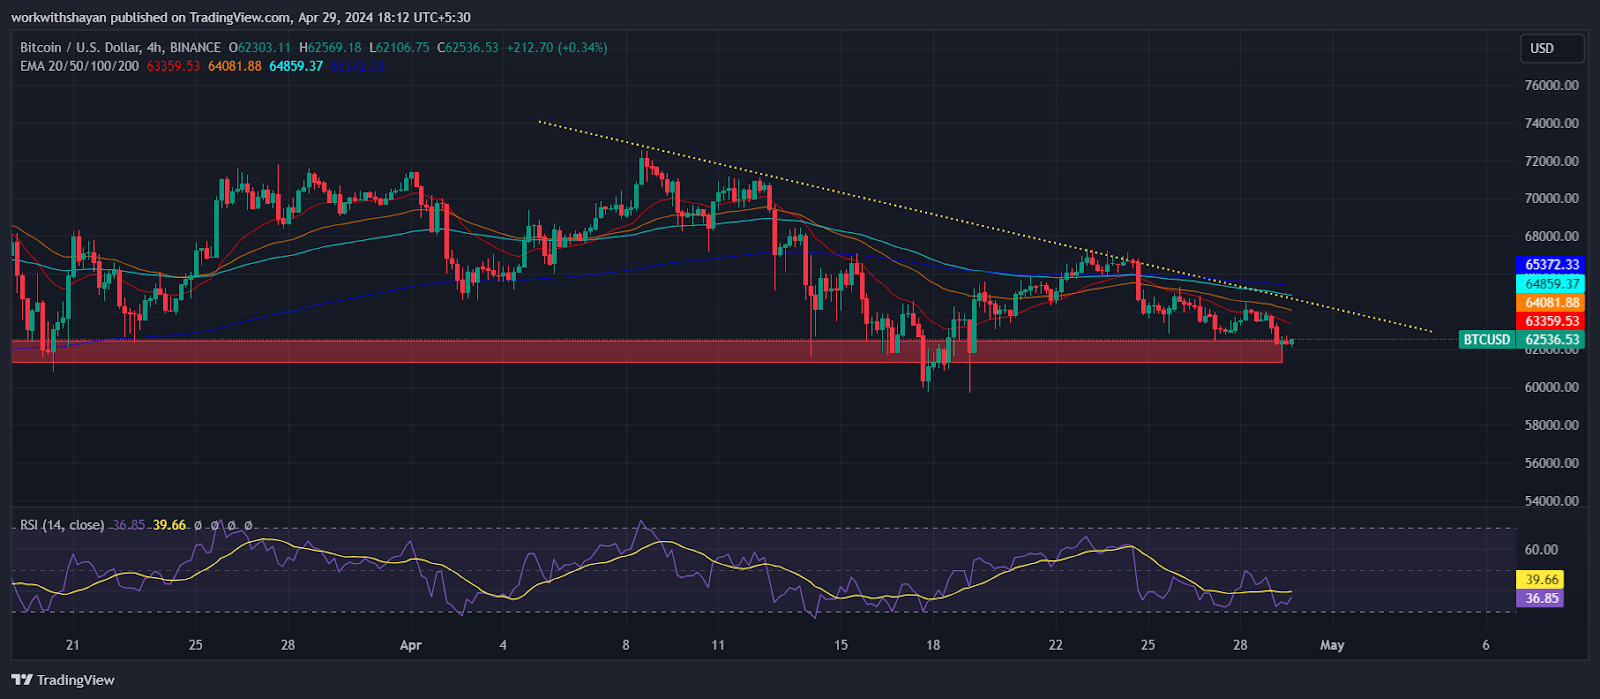
BTC/USDT Chart On TradingView
Typically, within such a range, traders tend to buy near the support levels and sell near the resistance levels. The $59K-$60K mark is anticipated to be vigorously defended by the bulls, as a breach beneath it might lead to a deeper correction towards the 61.8% Fibonacci retracement level at $54,300. Such a scenario could postpone the initiation of the next phase of upward movement.
Conversely, if the price rebounds from the current level or the $59K support, it would imply that bullish activity holds at lower levels. This could send the BTC/USDT pair towards $67K initially, and subsequently towards the upper resistance at $73,777. A breakout and close above this threshold would signify the commencement of the next upward phase towards $84,000.
However, the declining moving averages and the RSI hovering around the oversold region indicate an advantage to bears.