As bitcoin’s price action shows signs of continued bearishness, the digital currency’s trading volume and market capitalization suggest a volatile but keenly watched market.
Bitcoin
Bitcoin’s (BTC) current trading price of $62,891 to $63,075 per unit underscores a market grappling with uncertainty, reflected in an intraday trading range between $61,773 and $64,414 over the last 24 hours. The substantial volume of $36.08 billion, coupled with a market capitalization reaching $1.23 trillion, indicates active trading sessions but with a bearish bias as suggested by the prevalent selling actions across several key moving averages and oscillators. The overall market sentiment leans toward caution, influenced by the dominant negative signals.
The array of oscillator values presents a mixed view, where the commodity channel index (CCI) at -129 points toward a buying opportunity, potentially signaling an oversold condition. However, the relative strength index (RSI) at 41 and other neutral indicators, like the Stochastic and the average directional index, suggest a lack of momentum and directional clarity. Notably, BTC’s momentum and moving average convergence divergence (MACD) levels indicate strong sell signals, supporting the bearish sentiment prevalent in the market.
The moving averages (MAs) on various time frames largely advise selling, with both exponential and simple moving averages from the 10-day to the 50-day timeframe indicating a sell bias. This is counterbalanced somewhat by the longer-term 100-day and 200-day averages, where buying signals are evident, suggesting that while short-term pressures are bearish, there may be underlying support for a longer-term upward trend if these levels hold.
The 1-hour chart shows bitcoin failing to break the resistance at the $64,636 mark, with a decline indicated by a series of lower closes, pointing to a short-term control by sellers. Traders would be wise to monitor for either a bullish reversal or further confirmation of bearish trends, especially around the critical support level of $61,654.
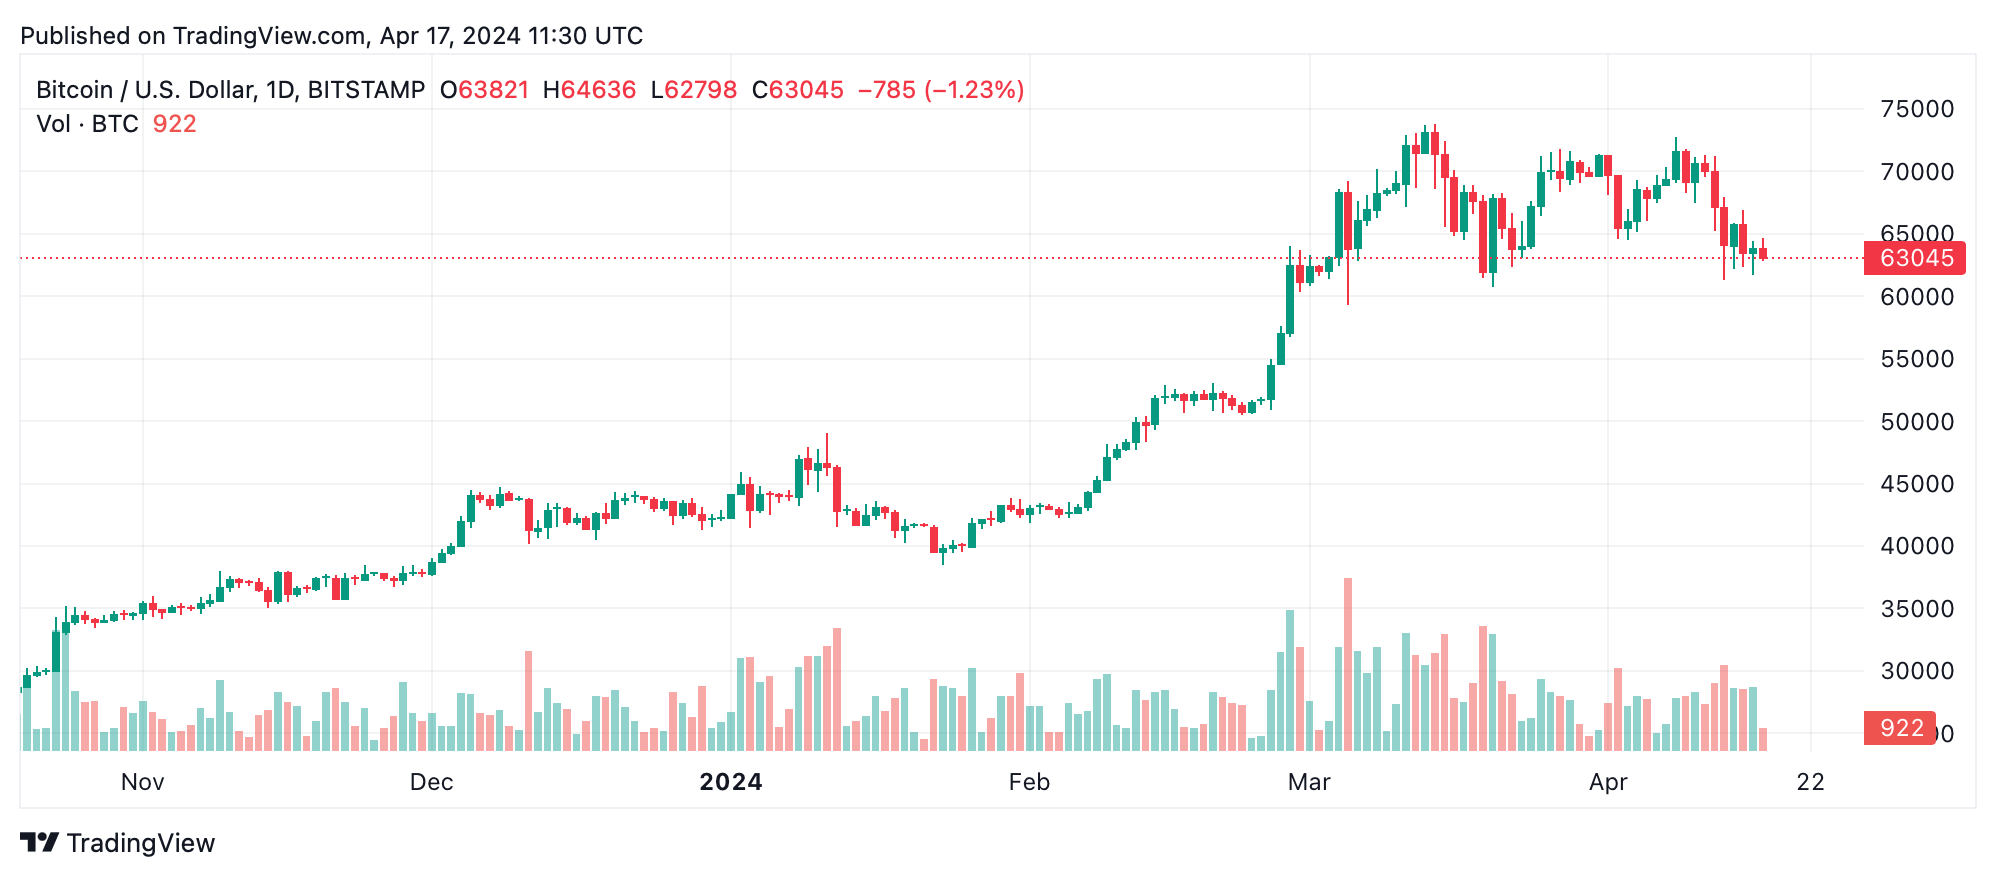
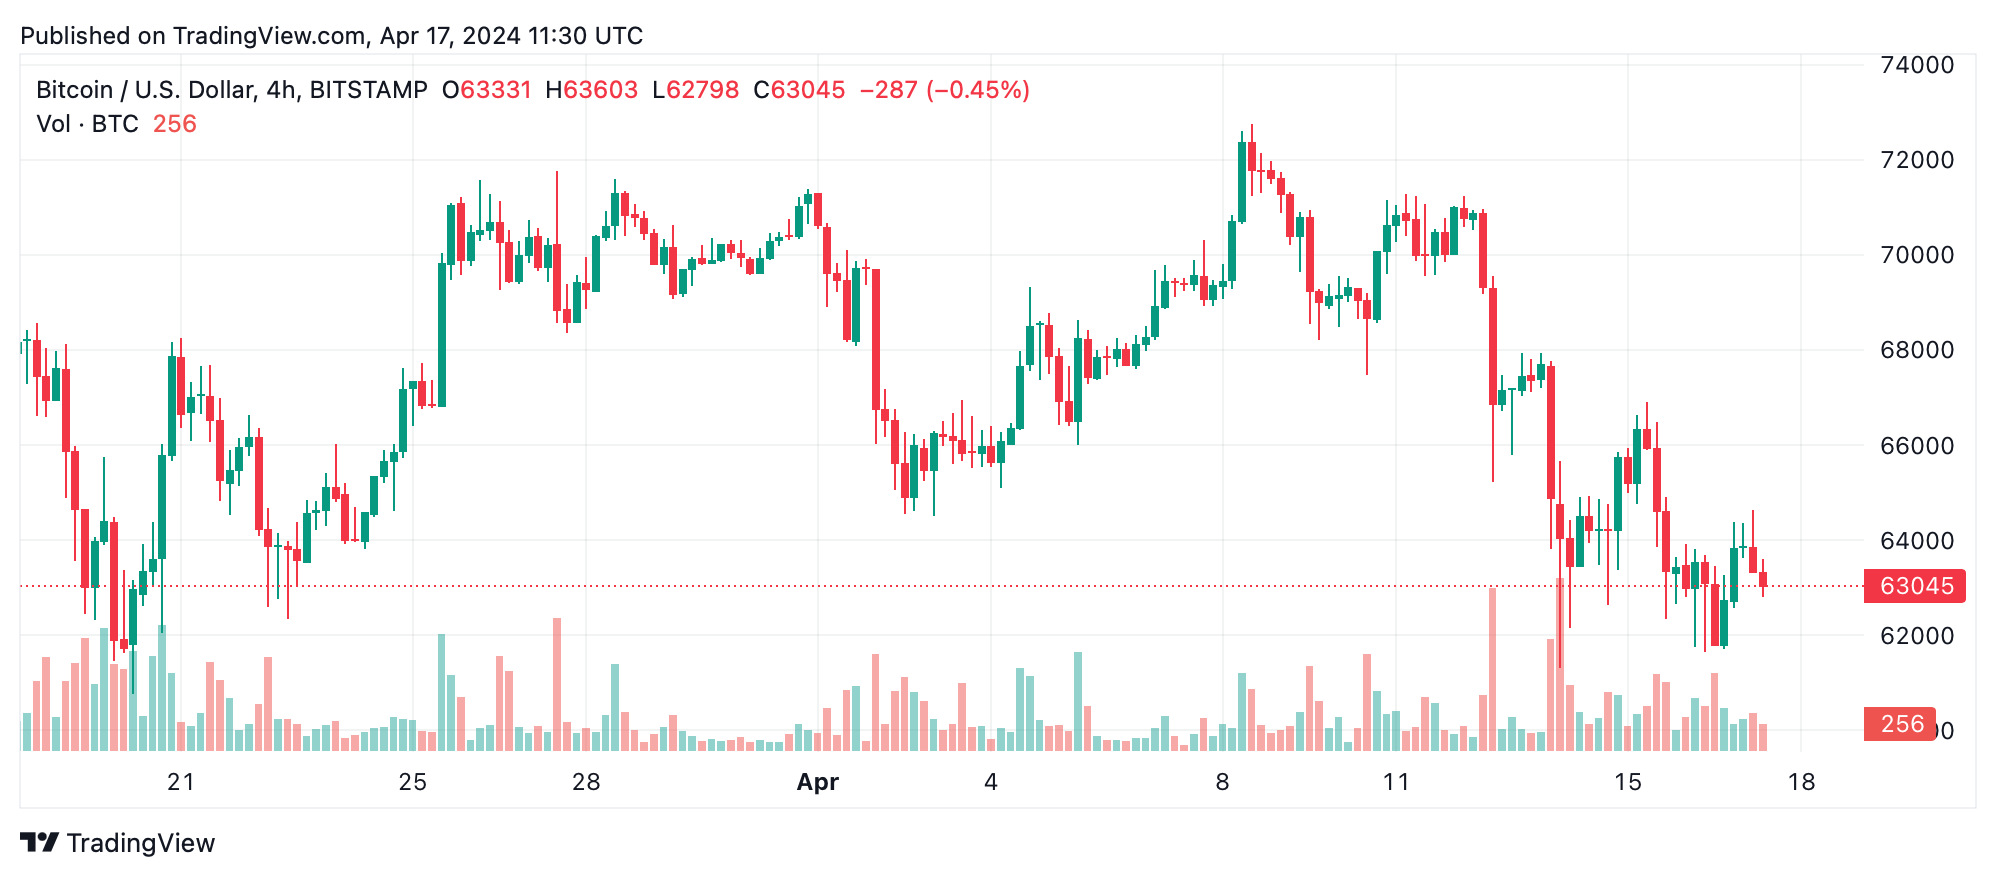
The 4-hour chart reveals broader price swings and a clear downward trend, suggesting bearish sentiment is not confined to shorter intervals. Resistance at $71,236 and support at $61,308 are pivotal for the next movements. Similarly, the daily chart indicates a definitive downtrend but with potential support around $60,760, offering a possible pivot for reversal if bullish signals emerge.
Bull Verdict:
Despite current bearish trends, bitcoin’s resilience at key support levels, particularly around $60,760, may herald a potential reversal. If buyers can consolidate strength and initiate a bullish pattern at this critical juncture, coupled with favorable indicators from long-term moving averages, there might be a robust opportunity for an upward trajectory. Traders should remain vigilant for signs of a momentum shift that could spark a bullish revival in the coming days.
Bear Verdict:
Bitcoin’s prevailing downtrend is corroborated by multiple technical indicators, from MAs suggesting continued sell signals in the short to medium term to oscillators that indicate a lack of buying momentum. The consistent formation of lower highs and lower lows across several timeframes paints a grim picture for the immediate future of bitcoin. Traders might consider preparing for further declines, especially if the price breaches the crucial support level at $60,760, potentially triggering a steeper sell-off.