- 1 SUI token price trades with a bearish bias and hovers below the $1 mark.
- 2 Technical indicators are displaying bear dominance and imply underperformance.
The Sui Network token (SUI) price directs follow-on selloff and persists in forming the lower low sequences, which implies a chart downtrend. For weeks, the token failed to resist the selloff and has eroded over 40% of gains in the last 30 trading sessions.
Recently, the bear army succeeded in smashing the round mark of $1 and still tried to push the token toward its demand region around $0.9000.
At press time, the Sui token (SUI) price traded at $0.9986 with an intraday drop of 4.30%, reflecting bearishness on the charts. It has a monthly return ratio of -41.20% and -15.20% yearly.
The pair of SUI/BTC is at 0.0000163 BTC, and the market cap is $525.37 Million. Analysts are bearish and suggest that the SUI token will continue to underperform and may stretch the downmove to $0.9000 ahead.
Still Up To The Bears or Pullback Is On the Horizon?
Following the market correction, the SUI token displayed a severe downturn from the top mark of $2 and slipped to the low mark of $1. However, the trend still favours the bear cartel and directs bearish momentum on the charts. The long/short ratio was noted at 0.9106.
Source: Santiment
The price action directs the distribution from the supply region of $2, and buyers cannot halt the gains. Moreover, the trading volume remained flat, replicating the low investor interest. The intraday volume dragged over 4.38% to $198.75 million.
X (Formerly Twitter) Followers and Social Dominance Insights
Per the Santiment data, the X (formerly Twitter) followers data showed an upmove and noted a positive outlook. The value stood near the midline and is indicated at 291.
Source: Santiment
The Social Dominance data highlights a downmove, and the value dragged to the mark of 0.136%, witnessed a neutral activity in the media discussion reports.
Derivative Data and RSI, MACD Overview
The derivative data showed long unwinding data and the open interest dropped over 3.73% to $124.92 Million.
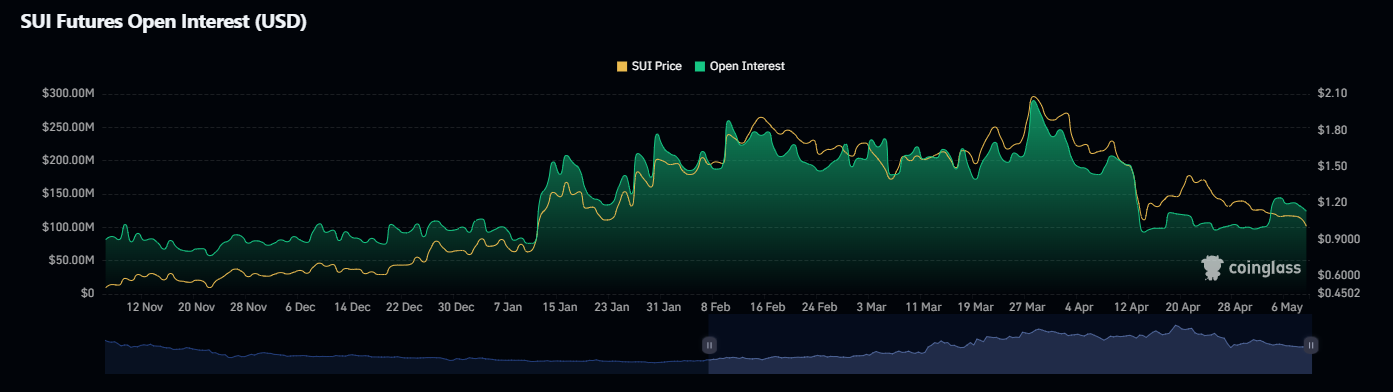
Source: coinglass
The Momentum Indicator (Relative Strength Index) looks negative, and the curve slipped to the oversold region, noting a negative crossover.
Similarly, the MACD indicator shows a bearish crossover, still showcasing red bars on the histogram. The immediate support levels for the Sui Network (SUI) are $0.9890 and $0.97600, whereas the key upside hurdle is around $1.10, followed by $1.20.
Conclusion
The Sui Network token (SUI) price hovered below the key moving averages and has depicted bearish waves on the charts. Amidst the correction, the token has lagged the momentum and eroded the initial gains.
Disclaimer
The views and opinions stated by the author or any other person named in this article are for informational purposes only and do not constitute financial, investment, or other advice.