If there are two cryptocurrencies with glaring underwhelming performance this year, then it is Ripple (XRP) and Terra Classic (LUNC). On a Year-To-Date (YTD) basis, the price of LUNC has decreased by 25.86%.
For XRP, it has been a struggle, as had lost 16.16% of its value since the year began. In recent days, not much has changed as the tokens continue to underperform.
However, traders may be watching these tokens, and wondering when sellers will get exhausted and if the prices will rebound. In this analysis, Coin Edition evaluated the short to mid-term potential of XRP and LUNC.
Ripple (XRP)
XRP’s price at press time was $0.52. The token was able to reach this level after sellers got exhausted at $0.49, and bulls were able to drive past the $0.51 resistance.
From the 4-hour XRP/USD chart, there was another resistance at $0.54. If bulls can break through this path, then the token might be on its way to $0.59. However, failure to rise past this zone might send XRP’s price back to $0.50.
Meanwhile, the Relative Strength Index (RSI) was above the neutral line, indicating that buying momentum remained pressure. Should the RSI reading increase, then XRP might key into the $0.54 resistance. But if the indicator drops, the price might swing between $0.50 and $0.52.

In addition, the Awesome Oscillator (AO) flashed red histogram bars, suggesting that the momentum might soon increase downwards. Should this happen, the aforementioned prediction of $0.54 could be invalidated.
Terra Classic (LUNC)
Interestingly, LUNC’s 4-hour structure was similar to SHIB. While the price was at $0.000107, the Bollinger Bands (BB) indicated that volatility around the token was low. With the contraction the BB showed, it could be challenging for LUNC to produce a parabolic upward move.
At the same time, a significant plunge might be off the table. As such, the price of LUNC might change hands between $0.000105 and $0.00011 at the highest.
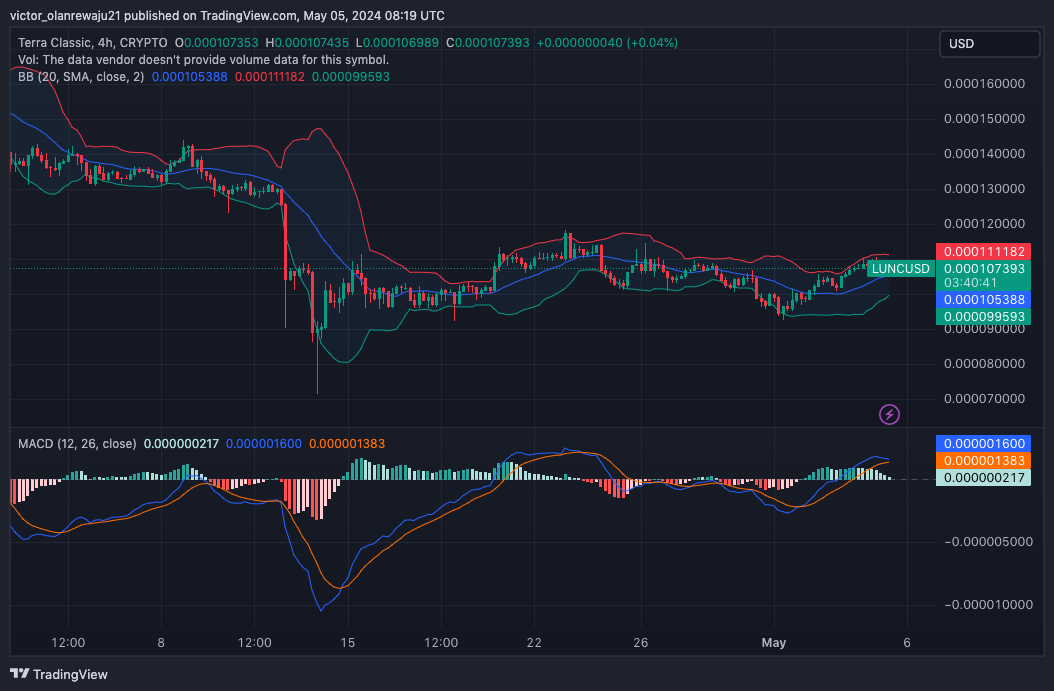
Meanwhile, the Moving Average Convergence Divergence (MACD) was positive, implying a bullish momentum. Thus, LUNC’s price seemed to have a higher chance of increasing than its potential to decline.
Disclaimer: The information presented in this article is for informational and educational purposes only. The article does not constitute financial advice or advice of any kind. Coin Edition is not responsible for any losses incurred as a result of the utilization of content, products, or services mentioned. Readers are advised to exercise caution before taking any action related to the company.