The Litecoin (LTC) price managed to increase last week despite an overall bearish crypto market, a decisive sign of strength.
While the increase is likely to continue in the short term, the long-term trend is still undetermined.
LTC Price Finishes Correction With Breakout
The analysis of LTC’s daily time frame suggests a positive forecast for its price, supported by several factors. Firstly, the price has broken out from a descending resistance line that had been present since April 18, indicating the completion of the previous correction.
The breakout was preceded by a strong bounce on May 8 (green icon), which reclaimed the 0.618 Fibonacci retracement support level.
The principle behind Fibonacci retracement levels suggests that after a considerable price movement in one direction, the price will retrace or go back partially to a previous price level before continuing in its original direction.
The 0.618 Fib level most often acts as the bottom during corrections. So, its reclaim is also a strong sign that the preceding correction has ended.
Secondly, LTC has completed a corrective pattern known as an A-B-C structure (white). This reinforces the belief that the correction has finished and a new upward movement has commenced.
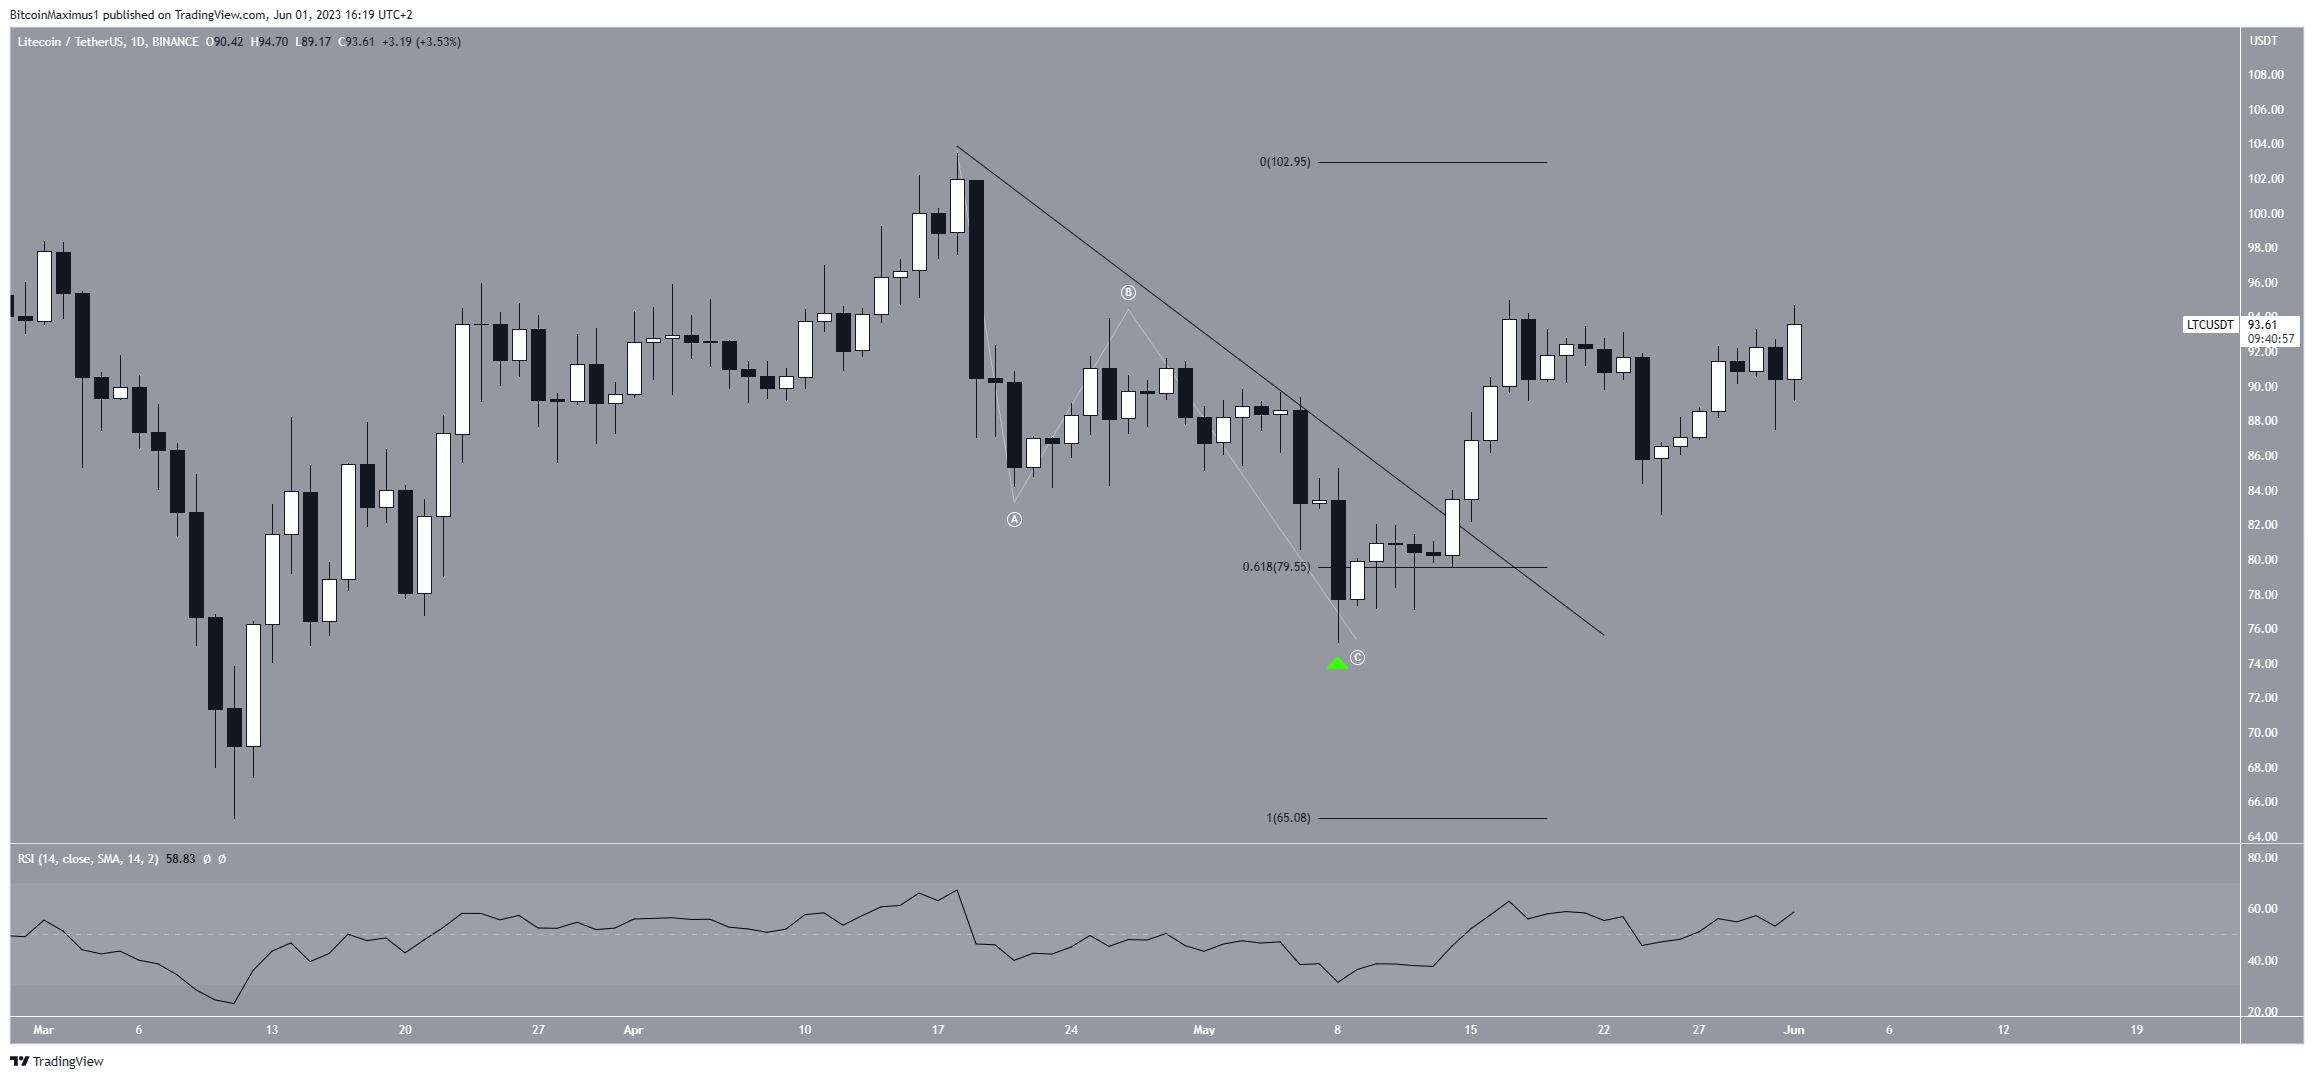
Finally, the RSI provides a bullish reading. By using the RSI as a momentum indicator, traders can determine whether a market is overbought or oversold and decide whether to accumulate or sell an asset.
If the RSI reading is above 50 and the trend is upward, bulls have an advantage. The opposite is true if the reading is below 50. The indicator is above 50 and increasing, a sign of a bullish trend.
Litecoin (LTC) Price Prediction: Will Price Reach $100?
Similarly to the daily time frame, the short-term six-hour time frame indicates that the increase will continue. The main reason for this is the wave count.
Technical analysts employ the Elliott Wave theory as a means to identify recurring long-term price patterns and investor psychology, which helps them determine the direction of a trend.
The LTC price began a five-wave increase since the aforementioned bounce on May 8. If so, it is currently in this upward movement’s fifth and final wave.
The most likely target for the top of this move is $102. The target is found by the 1.61 external fib retracement of wave four and the length of waves one and three (white). Due to this confluence, the area will likely act as the top.
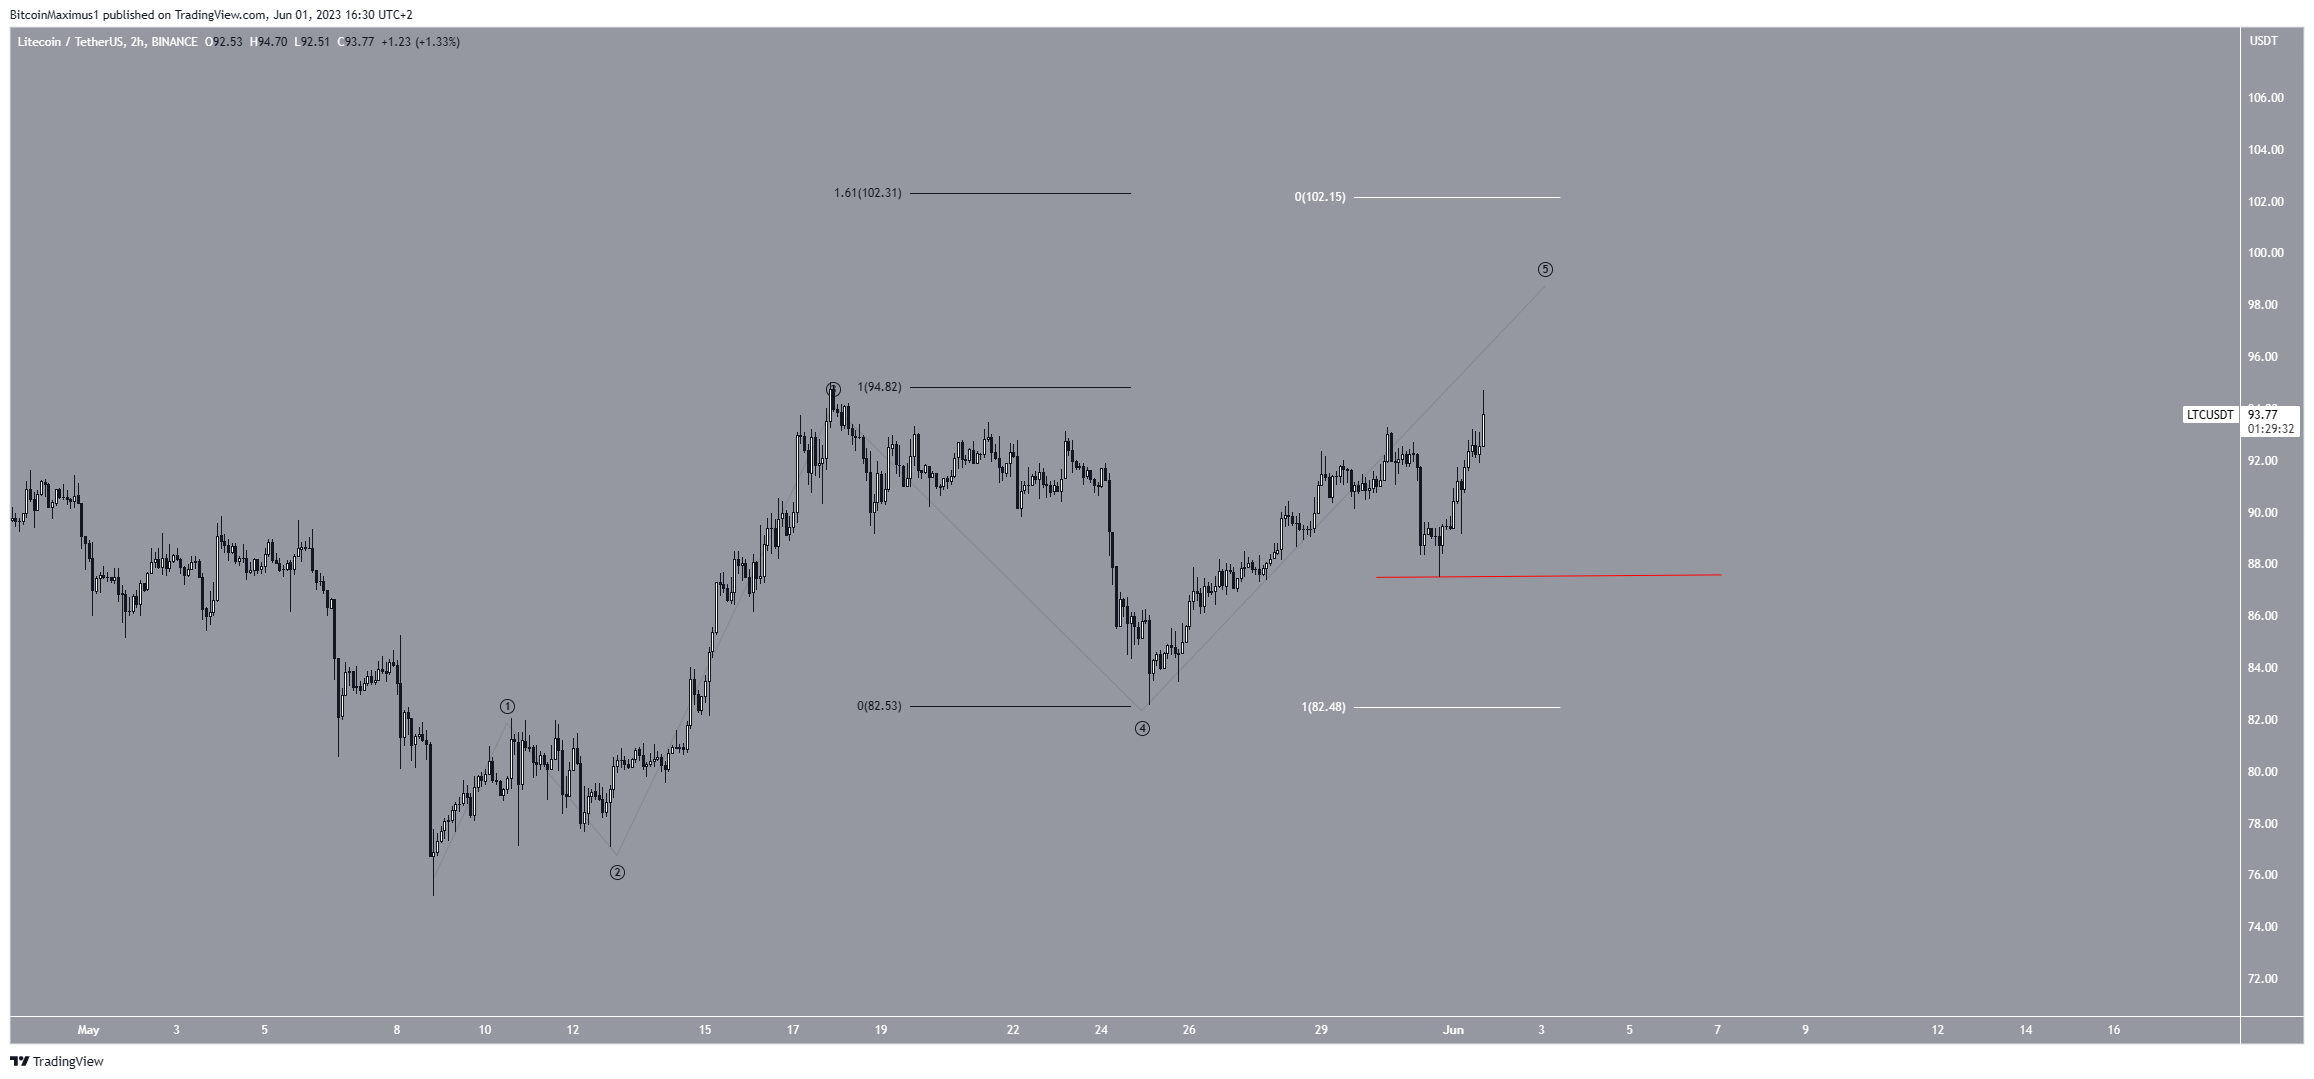
Despite this bullish LTC price prediction, a decrease below the local low of $87.50 will mean that the trend is bearish. In that case, the price can fall to the next closest support at $78.